Sea level rise
At least since 1880, the average global sea level has been rising. This is due mostly to anthropogenic global warming that is driving the thermal expansion of seawater while melting land-based ice sheets and glaciers . [1] This trend is expected to accelerate during the 21st century. [2] : 62
Page Revisions
| Year | Metadata | Sections | Top Words | First Paragraph |
| 2018 |
345699 characters 28 sections 67 paragraphs 29 images 591 internal links 225 external links |
sea 0.336 ice 0.325 ft 0.269 sheet 0.247 rise 0.156 mm 0.152 coastal 0.151 glaciers 0.140 metres 0.130 level 0.129 antarctic 0.118 greenland 0.117 melt 0.112 delta 0.111 melting 0.101 |
At least since 1880, the average global sea level has been rising. This is due mostly to anthropogenic global warming that is driving the thermal expansion of seawater while melting land-based ice sheets and glaciers . [1] This trend is expected to accelerate during the 21st century. [2] : 62 |
|
| 2017 |
377948 characters 32 sections 69 paragraphs 28 images 570 internal links 226 external links |
3. Current state of the sea level change |
mm 0.456 yr 0.404 sea 0.270 ice 0.213 sheet 0.187 rise 0.138 calendar 0.122 meltwater 0.120 metres 0.118 level 0.115 tide 0.109 greenland 0.107 0 0.098 antarctic 0.097 coastal 0.089 |
A sea level rise is an increase in global mean sea level as a result of an increase in the volume of water in the world’s oceans. Sea level rise is usually attributed to global climate change by thermal expansion of the water in the oceans and by melting of ice sheets and glaciers on land. [3] The melting of floating ice shelves and icebergs at sea would raise sea levels only by about 4 cm (1.6 in). [4] |
| 2016 |
333354 characters 30 sections 67 paragraphs 28 images 572 internal links 218 external links |
mm 0.437 yr 0.396 sea 0.279 ice 0.218 sheet 0.190 millimetres 0.178 rise 0.138 0 0.124 calendar 0.119 level 0.118 meltwater 0.117 greenland 0.105 tide 0.096 antarctic 0.095 metres 0.089 |
Sea level rise has been estimated to be on average between +2.6 millimetres (0.10 in) and 2.9 millimetres (0.11 in) per year ± 0.4 millimetres (0.016 in) since 1993 [3] and has accelerated in recent years. [4] For the period between 1870 and 2004, global average sea levels are estimated to have risen a total of 195 millimetres (7.7 in), and 1.7 millimetres (0.067 in) ± 0.3 millimetres (0.012 in) per year, with a significant acceleration of sea-level rise of 0.013 millimetres (0.00051 in) ± 0.006 millimetres (0.00024 in) per year. |
|
| 2015 |
318870 characters 29 sections 63 paragraphs 26 images 556 internal links 204 external links |
mm 0.431 yr 0.399 sea 0.273 ice 0.242 sheet 0.204 millimetres 0.179 rise 0.136 0 0.125 calendar 0.120 meltwater 0.118 level 0.116 greenland 0.106 tide 0.097 antarctic 0.096 metres 0.090 |
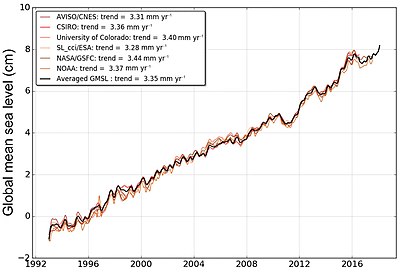
Sea level rise has been estimated to be on average between +2.6 millimetres (0.10 in) and 2.9 millimetres (0.11 in) per year ± 0.4 millimetres (0.016 in) since 1993. Additionally, sea level rise has accelerated in recent years. [2] For the period between 1870 and 2004, global average sea levels are estimated to have risen a total of 195 millimetres (7.7 in), and 1.7 millimetres (0.067 in) ± 0.3 millimetres (0.012 in) per year, with a significant acceleration of sea-level rise of 0.013 millimetres (0.00051 in) ± 0.006 millimetres (0.00024 in) per year per year. According to one study of measurements available from 1950 to 2009, these measurements show an average annual rise in sea level of 1.7 millimetres (0.067 in) ± 0.3 millimetres (0.012 in) per year during this period, with satellite data showing a rise of 3.3 millimetres (0.13 in) ± 0.4 millimetres (0.016 in) per year from 1993 to 2009. [3] Sea level rise is one of several lines of evidence that support the view that the global climate has recently warmed . [4] In 2014 the USGCRP National Climate Assessment projected that by the year 2100, the average sea level rise will have been between one and four feet (300mm-1200mm) since the date of the 2014 assessment. Current rates of sea level rise have roughly doubled since the pre 1992 rates of sea level rise of the 20th century. [5] |
|
| 2014 |
331153 characters 36 sections 74 paragraphs 22 images 591 internal links 204 external links |
1. Overview of sea-level change 7. Effects of snowline and permafrost |
mm 0.546 yr 0.402 sea 0.272 ice 0.228 level 0.119 sheet 0.118 greenland 0.116 acceleration 0.113 rise 0.108 metres 0.104 sheets 0.090 0 0.089 tide 0.086 antarctica 0.085 glaciers 0.085 |
Current sea level rise is about 3 mm/year worldwide. According to the US National Oceanic and Atmospheric Administration (NOAA), "this is a significantly larger rate than the sea-level rise averaged over the last several thousand years", and the rate may be increasing. [2] Sea level rises can considerably influence human populations in coastal and island regions [3] and natural environments like marine ecosystems . [4] |
| 2013 |
327806 characters 35 sections 71 paragraphs 23 images 588 internal links 202 external links |
1. Overview of sea-level change 7. Effects of snowline and permafrost |
mm 0.530 yr 0.404 sea 0.273 ice 0.237 sheet 0.123 greenland 0.120 level 0.118 acceleration 0.108 rise 0.107 sheets 0.093 metres 0.091 0 0.090 tide 0.089 antarctica 0.088 glaciers 0.088 |
Current sea-level rise is about 3 mm/year worldwide. According to the National Oceanic and Atmospheric Administration (NOAA), "this is a significantly larger rate than the sea-level rise averaged over the last several thousand years", and the rate may be increasing. [2] This rise in sea levels around the world potentially affects human populations (e.g., those living in coastal regions and on islands) [3] and the natural environment (e.g., marine ecosystems ). [4] Between 1870 and 2004, global average sea levels rose 195 mm (7.7 in). [5] From 1950 to 2009, measurements show an average annual rise in sea level of 1.7 ± 0.3 mm per year, with satellite data showing a rise of 3.3 ± 0.4 mm per year from 1993 to 2009, [6] a faster rate of increase than previously estimated. [7] It is unclear whether the increased rate reflects an increase in the underlying long-term trend. [8] |
| 2012 |
311251 characters 34 sections 68 paragraphs 21 images 574 internal links 191 external links |
1. Overview of sea-level change 7. Effects of snowline and permafrost |
mm 0.530 yr 0.418 sea 0.265 ice 0.233 sheet 0.127 greenland 0.120 level 0.115 rise 0.105 acceleration 0.102 sheets 0.096 metres 0.094 tide 0.092 0 0.090 glaciers 0.086 antarctica 0.086 |
Sea levels around the world are rising. Current sea-level rise potentially impacts human populations (e.g., those living in coastal regions and on islands) [3] and the natural environment (e.g., marine ecosystems ). [4] Between 1870 and 2004, global average sea levels rose 17 cm (6.7 in). [5] From 1950 to 2009, measurements show an average annual rise in sea level of 1.7 ± 0.3 mm with satellite data showing a rise of 3.3 ± 0.4 mm from 1993 to 2009, [6] a faster rate of increase than previously estimated. [7] It is unclear whether the increased rate reflects an increase in the underlying long-term trend. [8] |
| 2011 |
301621 characters 34 sections 67 paragraphs 19 images 590 internal links 182 external links |
1. Overview of sea-level change 7. Effects of snowline and permafrost |
mm 0.504 yr 0.428 sea 0.269 ice 0.238 sheet 0.130 greenland 0.127 level 0.118 rise 0.106 metres 0.105 acceleration 0.105 sheets 0.099 tide 0.094 0 0.088 glaciers 0.088 20th 0.087 |
Sea levels are rising. Current sea level rise potentially impacts human populations (e.g., those living in coastal regions and on islands) [1] and the natural environment (e.g., marine ecosystems ). [2] Global average sea level rose at an average rate of around 1.7 +-.3mm per year over 1950 to 2009 and at a satellite-measured average rate of about 3.3 +-.4mm per year from 1993 to 2009, [3] an increase on earlier estimates. [4] It is unclear whether the increased rate reflects an increase in the underlying long-term trend. [5] |
| 2010 |
232361 characters 26 sections 48 paragraphs 15 images 555 internal links 115 external links |
1. Overview of sea-level change 6. Effects of snowline and permafrost |
yr 0.513 mm 0.465 sea 0.255 ice 0.227 greenland 0.131 level 0.110 glaciers 0.102 metres 0.102 tide 0.097 rise 0.097 sinking 0.095 sheet 0.094 gauges 0.093 melting 0.090 sheets 0.090 |
Current Sea Level Rise has occurred at a mean rate of 1.8 mm per year for the past century, [1] [2] and more recently, during the satellite era of sea level measurement, at rates estimated near 2.8 ± 0.4 [3] to 3.1 ± 0.7 [4] mm per year (1993–2003). Current sea level rise is suggested to be due significantly to global warming , [5] which will increase sea level over the coming century and longer periods. [6] [7] Increasing temperatures result in sea level rise by the thermal expansion of water and through the addition of water to the oceans from the melting of mountain glaciers , ice caps and ice sheets . At the end of the 20th century, thermal expansion and melting of land ice contributed roughly equally to sea level rise, while thermal expansion is expected to contribute more than half of the rise in the upcoming century. [8] |
| 2009 |
226054 characters 26 sections 44 paragraphs 13 images 546 internal links 106 external links |
1. Overview of sea-level change 6. Effects of snowline and permafrost |
yr 0.520 mm 0.460 sea 0.259 ice 0.226 greenland 0.133 level 0.112 rise 0.102 sheets 0.100 tide 0.099 sinking 0.096 sheet 0.095 metres 0.093 glaciers 0.092 antarctica 0.091 acceleration 0.090 |
Current sea level rise has occurred at a mean rate of 1.8 mm per year for the past century, [1] [2] and more recently at rates estimated near 2.8 ± 0.4 [3] to 3.1 ± 0.7 [4] mm per year (1993-2003). Current sea level rise is due significantly to global warming , [5] which will increase sea level over the coming century and longer periods. [6] [7] Increasing temperatures result in sea level rise by the thermal expansion of water and through the addition of water to the oceans from the melting of continental ice sheets . Thermal expansion, which is well-quantified, is currently the primary contributor to sea level rise and is expected to be the primary contributor over the course of the next century. Glacial contributions to sea-level rise are less important, [8] and are more difficult to predict and quantify. [8] Values for predicted sea level rise over the course of this century typically range from 90 to 880 mm, with a central value of 480 mm. Based on an analog to the deglaciation of North America at 9,000 years before present, some scientists predict sea level rise of 1.3 metres in this century. [9] [10] However, models of glacial flow in the smaller present-day ice sheets show that a probable maximum value for sea level rise in the current century is 800 millimetres , based on limitations on how quickly ice can flow below the equilibrium line altitude and to the sea. [11] |
| 2008 |
203698 characters 25 sections 54 paragraphs 12 images 331 internal links 114 external links |
1. Overview of sea-level change 5. Effects of snowline and permafrost |
yr 0.548 mm 0.468 sea 0.253 ice 0.189 greenland 0.126 level 0.111 tide 0.110 acceleration 0.100 gauge 0.096 sinking 0.095 gauges 0.094 rise 0.090 glaciers 0.086 sheets 0.083 permafrost 0.082 |
The sea level has been rising at a rate of around 1.8 mm per year for the past century, [1] [2] mainly as a result of human-induced global warming . [3] This rate is increasing; measurements from the period 1993–2000 indicated a mean rate of 3.1 mm/year. [4] Global warming will continue to increase sea level over at least the coming century. [5] The contribution from thermal expansion is well understood; substantial changes to the rate and magnitude of increase are largely dependent on how rapidly ice caps disintegrate with increasing temperatures—which is very difficult to model. [6] The thermal expansion of sea water is currently the dominant contributor to sea level rise, and to the predicted rise over the next century, which is 90 to 880 mm (with a central value of 480 mm). Only if glacial melt substantially increases will it become the larger term. [6] Ice can have a huge effect; the melting of the ice caps during the end of the last ice age resulted in a 120 meters rise in sea level. |
| 2007 |
193617 characters 27 sections 55 paragraphs 13 images 378 internal links 85 external links |
5. Effects of snowline and permafrost |
yr 0.587 mm 0.468 sea 0.256 ice 0.186 level 0.113 acceleration 0.112 greenland 0.110 tide 0.101 0 0.089 gauge 0.087 sinking 0.087 rise 0.086 gauges 0.086 sheets 0.083 glaciers 0.079 |
Sea-level has risen about 130 metres (400 ft) since the peak of the last ice age about 18,000 years ago. Most of the rise occurred before 6,000 years ago. From 3,000 years ago to the start of the 19th century sea level was almost constant, rising at 0.1 to 0.2 mm /yr. [1] Since 1900 the level has risen at 1 to 2 mm/yr; since 1993 satellite altimetry from TOPEX/Poseidon indicates a rate of rise of 3.1 ± 0.7 mm yr–1 [2] . It is very likely that 20th century warming has contributed significantly to the observed sea-level rise, through thermal expansion of sea water and widespread loss of land ice [3] . Church and White (2006) found a sea-level rise from January 1870 to December 2004 of 195 mm, a 20th century rate of sea-level rise of 1.7 ±0.3 mm per yr and a significant acceleration of sea-level rise of 0.013 ± 0.006 mm per year per yr. If this acceleration remains constant, then the 1990 to 2100 rise would range from 280 to 340 mm, [2] . Sea-level rise can be a product of global warming through two main processes: expansion of sea water as the oceans warm, and melting of ice over land. Global warming is predicted to cause significant rises in sea level over the course of the twenty-first century. |
| 2006 |
141489 characters 21 sections 51 paragraphs 6 images 107 internal links 70 external links |
5. Effects of snowline and permafrost |
yr 0.614 mm 0.437 sea 0.254 ice 0.189 greenland 0.121 level 0.113 tide 0.098 sheets 0.091 glaciers 0.086 observational 0.082 permafrost 0.082 0 0.080 antarctica 0.078 sheet 0.073 metres 0.072 |
The sea level has risen more than 120 metres since the peak of the last ice age about 18,000 years ago. The bulk of that occurred before 6,000 years ago. From 3,000 years ago to the start of the 19th century sea level was almost constant, rising at 0.1 to 0.2 mm /yr; since 1900 the level has risen at 1 to 3 mm/yr; [1] since 1992 satellite altimetry from TOPEX/Poseidon indicates a rate of about 3 mm/yr. [2] This change may be the first sign of the effect of global warming on sea level. [ citation needed ] Global warming is predicted to cause significant rises in sea level over the course of the twenty-first century. |
| 2005 |
77370 characters 19 sections 46 paragraphs 6 images 91 internal links 59 external links |
yr 0.639 mm 0.478 sea 0.235 ice 0.167 level 0.105 tide 0.102 greenland 0.090 sheets 0.086 observational 0.086 gauges 0.082 0 0.079 antarctica 0.074 acceleration 0.070 glaciers 0.066 metres 0.064 |
The sea level has risen more than 120 metres since the peak of the last ice age about 18,000 years ago. The bulk of that occurred before 6000 years ago. From 3000 years ago to the start of the 19th century sea level was almost constant, rising at 0.1 to 0.2 mm /yr; since 1900 the level has risen at 1 to 3 mm/yr [1] ; since 1992 satellite altimetry from TOPEX/Poseidon indicates a rate of about 3 mm/yr [2] . This change may be the first signs of the effect of global warming on sea level, which is predicted to cause significant rises in sea level over the course of the twenty-first century. |
|
| 2004 |
16650 characters 6 sections 16 paragraphs 1 images 24 internal links 13 external links |
1. Local and Eustatic Sea Level 3. Factors affecting present-day sea-level change |
yr 0.537 mm 0.509 sea 0.194 boulder 0.119 risen 0.117 kyr 0.093 0 0.090 level 0.088 1990s 0.083 289 0.073 occasional 0.073 isostatic 0.073 millimeters 0.073 tides 0.073 topex 0.073 |
Sea level has risen more than 120 m since the peak of the last ice age 20 kyr ago. The bulk of that occurred before 6 kyr ago. From 3000 years ago to the start of the 19th century sea level was almost constant; since 1900 the level has risen at 1-2 mm/y; since 1992 at about 3 mm/y. |
| 2003 |
2807 characters 2 sections 4 paragraphs 0 images 7 internal links 1 external links |
contend 0.364 slr 0.221 wiping 0.221 alpine 0.220 glaciers 0.200 assert 0.182 org 0.182 http 0.182 shore 0.182 polar 0.179 sea 0.161 climatologists 0.159 tuvalu 0.159 inevitably 0.159 expand 0.159 |
Sea level rise is a phenomenon caused by the melting of polar and alpine glaciers , the expansion of water due to global warming , and on the geologic scale , by changes in the relative amount of sediment in ocean basins. The fact that sea level has risen at a relatively rapid rate over the last century, is frequently used as supporting evidence that the activities of humans are changing the world environment. |
|
| 2002 |
2917 characters 2 sections 5 paragraphs 0 images 7 internal links 1 external links |
contend 0.368 slr 0.224 wiping 0.224 alpine 0.223 glaciers 0.202 assert 0.184 org 0.184 http 0.184 shore 0.184 polar 0.182 sea 0.163 tuvalu 0.161 inevitably 0.161 expand 0.161 basins 0.161 |
Sea level rise is a phenomenon caused by; melting of polar and alpine glaciers, the expansion of water due to global warming , and, on a geologic scale , by changes in the relative amount of sediment in ocean basins. The fact that sea level has risen at a relatively rapid rate over the last century, is frequently used as supporting evidence that the activities of humans are changing the world environment. |